Following the announcement on March 12, 2020 regarding the COVID-19 Transmission Model Driven by Pre-symptomatic Carriers, the team of researchers led by Professor Lei-Han Tang from the Hong Kong Baptist University and the Beijing Computational Science Research Center has advanced the model to quantify the infected population and assess the impact of different intervention measures. The advancement comes at a critical time as the COVID-19 pandemic rapidly spreads worldwide 1,2. Their work, announced at https://arxiv.org/abs/2003.07353, enables direct integration of clinical findings on the current disease transmission characteristics for forecasting epidemic development at regional and national levels. Various intervention scenarios can then be simulated for swift government action.
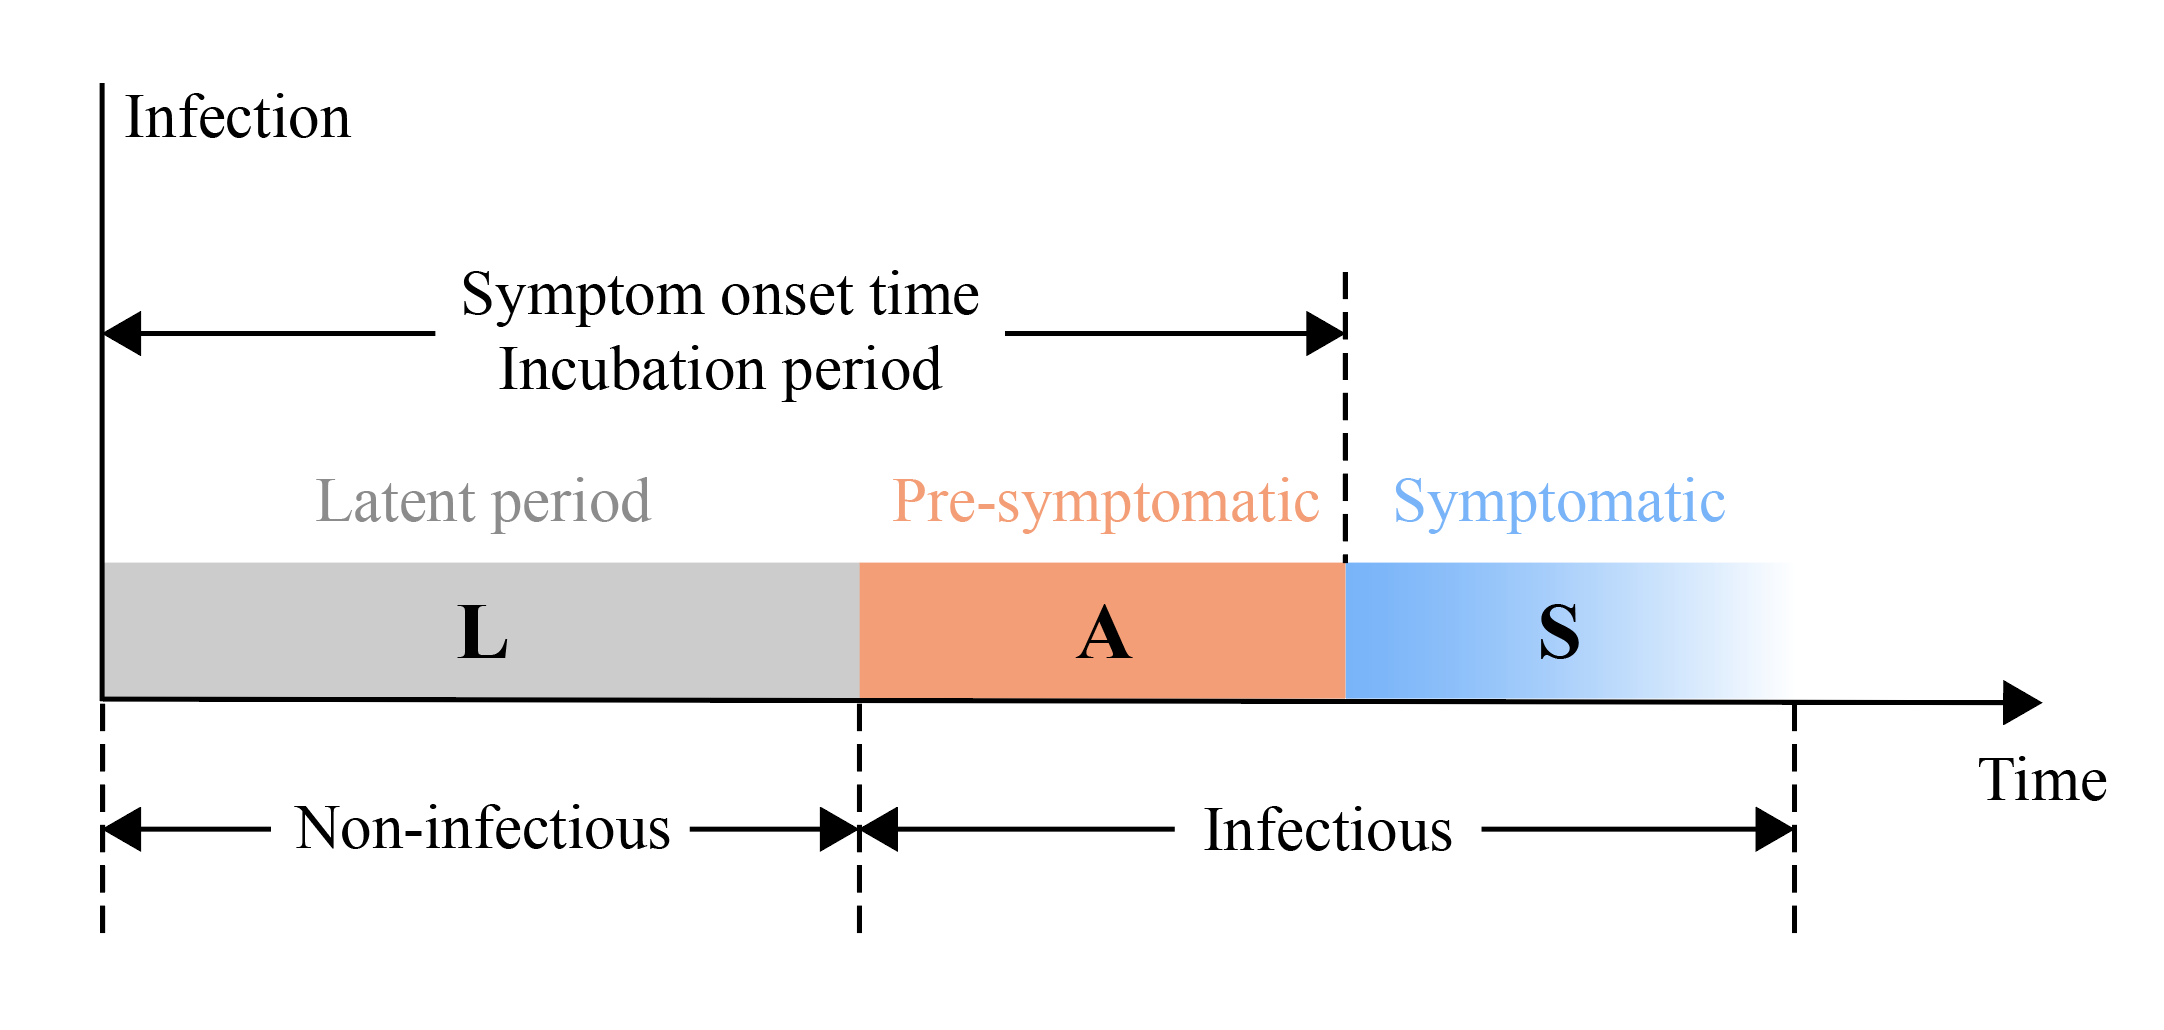
The new modelling framework is based on the COVID-19 disease progression and transmission characteristics illustrated in the accompanying Fig. 1. Previous studies have established that secondary transmission peaks around the symptom onset date of the infected person 3-6, with a time window of 1 to 3 days 5. This observation allows the team to construct a stochastic transmission model from the statistics of the symptom onset time. Although the general structure of their model is similar to the well-known Susceptible-Exposed-Infected-Recovered (SEIR) model in the epidemiological community, the explicit use of the symptom onset time distribution, which they calibrated from reported clinical case studies 5,7, marks an important advancement in predictive modelling. The novel, clinical data-driven approach removes a range of limitations in the more traditional statistical inference scheme for posterior analysis of a disease outbreak that took place in a specific region. Indeed, as the COVID-19 escalates into a global pandemic of unprecedented proportion, many fundamentals of the disease propagation are evolving rapidly, shaped by societal and cultural factors as well as changing government policies 8.
Based on the model, the research team analysed the effect of contact tracing and isolation, which take close contacts of an infected person out of the transmission cycle. They found that, at a daily growth rate of 0.3 seen in Europe and the USA in late March, contact tracing and isolation can level off the epidemic growth if executed in the first 3 days of COVID-19 contraction with 100% efficiency, i.e., all the newly infected cases are found within such a time window. At 80% efficiency, the time window to achieve the same effect shrinks to just over 1 day. In comparison, one-time testing and quarantining of only those with positive results were found to have a much weaker effect in slowing down the exponential growth.
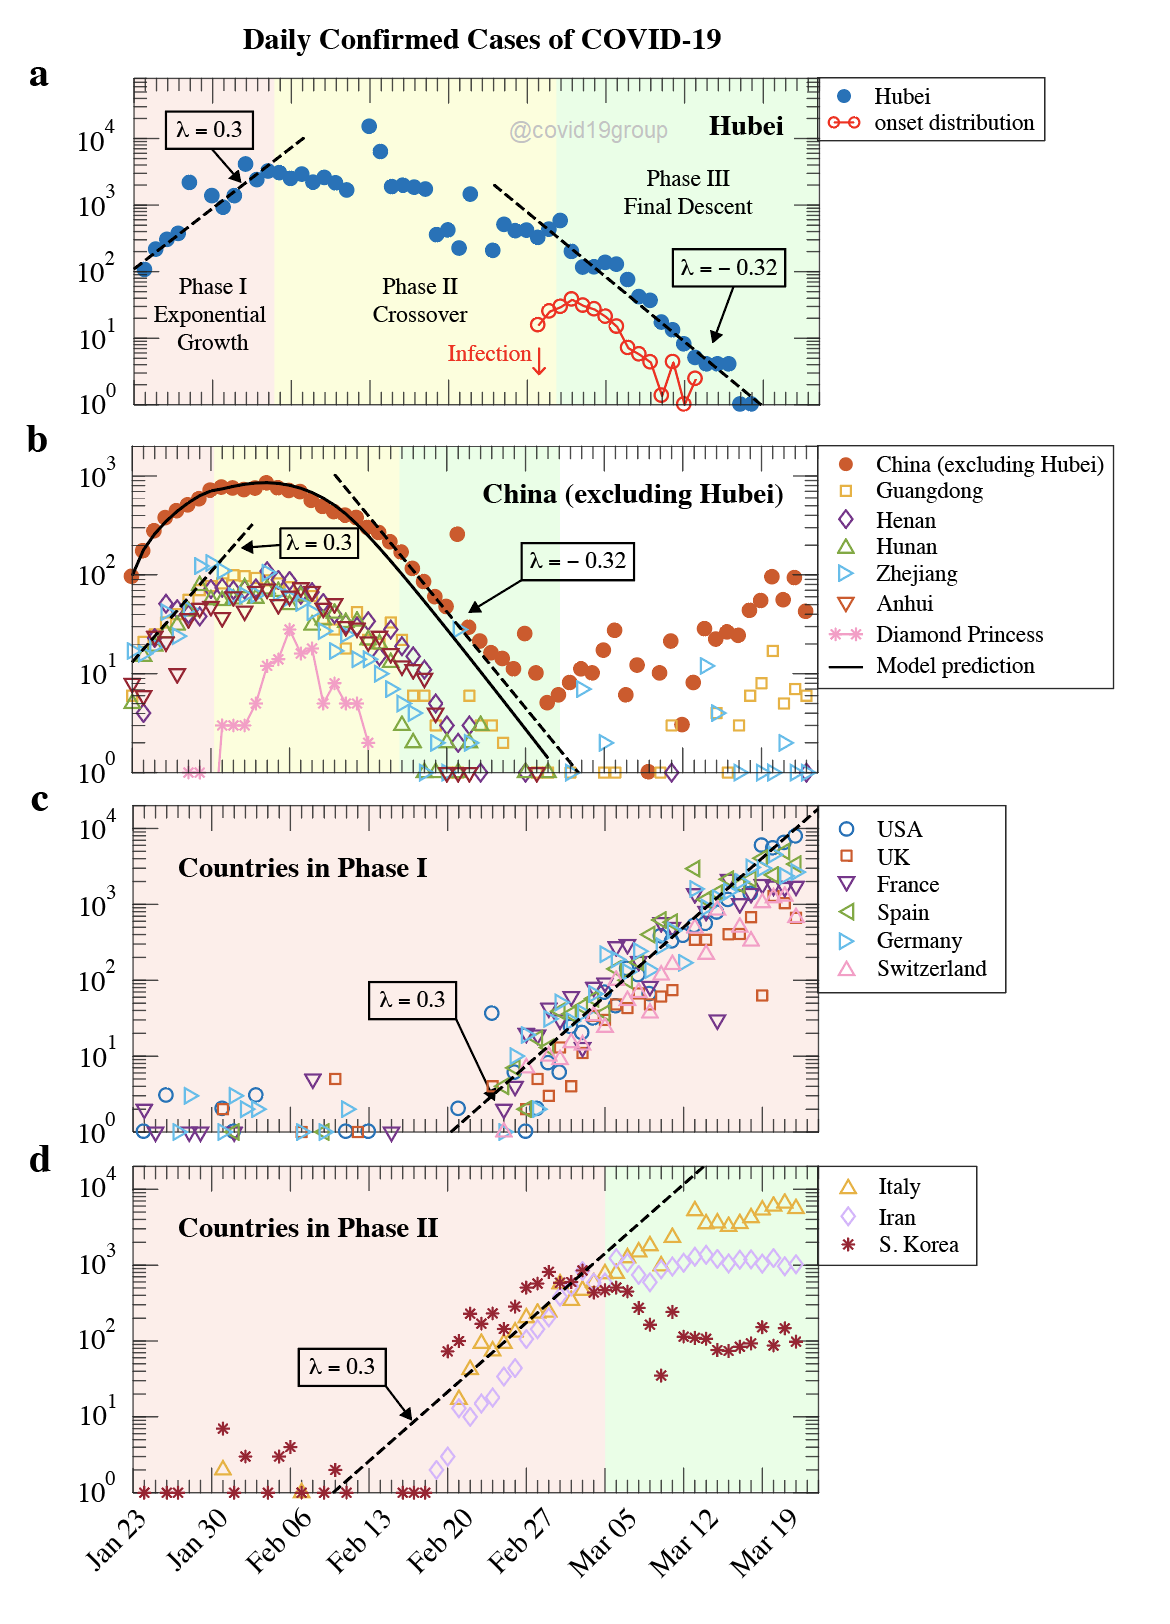
Although designed to model a single outbreak in a given community, the model also contributes to the interpretation of universal features in the COVID-19 epidemic development data across different regions and countries, as illustrated in the accompanying Fig. 2. Data from the Johns Hopkins CSSE Repository 2 on China shows striking similarities in epidemic developments in provinces across the country since the Wuhan lockdown on January 23, 2020, with clear demarcation into three phases indicated by coloured temporal intervals. Phase I corresponds to the initial exponential growth seeded by imported cases. It lasted only about one week after the lockdown. The synchronised growth rate of approximately 0.3 per day is attributed to infections that took place in Hubei province, with limited contribution from local cases. After decoupling from the still ongoing epidemic in Hubei, the rest of the country moved into the crossover phase II, lasting about 2 weeks. During this period, despite the increasingly stringent tracking, isolation and quarantine measures, sporadic outbreaks emerged in closed communities, but they were quickly discovered and contained. In phase III, a negative growth rate of /day is seen nationally as well as within each province. Mathematical analysis of the model attributes this maximal decay rate at zero transmission to the tail of the symptom onset time distribution.
In Hubei province, where the outbreak originated, the crossover phase continued for two more weeks due to a much more elevated scale of the epidemic that overwhelmed the local public health and disease control capacity. Such behaviour is reproduced by the model when a slowly declining transmission rate is assumed. However, starting from about March 3, 2020, the decreasing rate in the number of newly confirmed cases began to conform to and finally reached the value seen in the rest of the country, indicating that new infections had largely stopped.
Exponential growth with a daily growth rate of around 0.3 is seen in the latest epidemic data from many countries. While these outbreaks were initially seeded by imported cases, they are now largely driven by local infections. Under successful interventions, a few countries have transitioned to the crossover phase observed in China in February. The government of Italy imposed a national quarantine on March 9, after which growth in the number of newly confirmed cases slowed down. The research team fitted the data after March 9, which yields a growth rate of 0.05/day, corresponding to according to their model. South Korea adopted very aggressive contact tracing and testing policies, enabling the country to bring the initially rampaging outbreak to a much more manageable level at . These countries are now facing the challenge of dealing with new infections driven by imported viral carriers, which can also be analysed using the model.
The fact that epidemic data from many European countries and the USA are still growing untamed despite the stringent border controls and social distancing measures is alarming. This cannot be entirely interpreted as due to the latent infected population when one looks at the speed at which the same type of data turned around in only one week on the Diamond Princess cruise ship and in China once house-confinement policies were implemented. Based on their model analysis, the team believes that current intervention measures in these countries have not achieved enough impact on COVID-19 spreading in the most active and open social channels, despite the substantial lifestyle changes already experienced by ordinary citizens. The study found that pre-symptomatic transmission, which shortens the generation time, plays a more significant role in the fast growing phase. At a growth rate of 0.3/day, over 70% of the infected population have not developed severe symptoms. Therefore, massive and strict shelter-in-place are required until efficient and continuing testing can isolate the infected people from the community. Only with drastically new intervention policies and real-time monitoring and analysis of the changing dynamic will it be possible to steer the pandemic through phase II and into the concluding phase III.
Hong Kong Baptist University
Beijing Computational Science Research Center
March 28, 2020
Sources:
World Health Organization. Coronavirus disease 2019 (COVID-19) Situation Report – 68(2020).https://www.who.int/docs/default-source/coronaviruse/situation-reports/20200328-sitrep-68-covid-19.pdf?sfvrsn=384bc74c_2
Dong, E. et al. An interactive web-based dashboard to track COVID-19 in real time. The Lancet Infectious Diseases (2020). https://doi.org/10.1016/S1473-3099(20)30120-1
He, X. et al. Temporal dynamics in viral shedding and transmissibility of COVID-19. medRxiv (2020). https://doi.org/10.1101/2020.03.15.20036707
To, K. K. et al. Temporal profiles of viral load in posterior oropharyngeal saliva samples and serum antibody responses during infection by SARS-CoV-2: an observational cohort study. The Lancet Infectious Diseases (2020). https://doi.org/10.1016/S1473-3099(20)30196-1
Xia, W. et al. Transmission of coronavirus disease 2019 during the incubation period may lead to a quarantine loophole. medRxiv (2020). https://doi.org/10.1101/2020.03.06.20031955
Zou, L. et al. SARS-CoV-2 viral load in upper respiratory specimens of infected patients. New England Journal of Medicine (2020). https://doi.org/10.1056/NEJMc2001737
Men, K. et al. Estimate the incubation period of coronavirus 2019 (COVID-19). medRxiv (2020). https://doi.org/10.1101/2020.02.24.20027474
Anderson, R. M. et al. "How will country-based mitigation measures influence the course of the COVID-19 epidemic?" The Lancet (2020). https://doi.org/10.1016/S0140-6736(20)30567-5
Accompanying Figures
Figure 1

Figure 2


